Drop in a CSV and share a dashboard with nothing stored.
Free for 10 share links a day.
From CSV to chart without a spreadsheet
A CRM export lands as rows nobody reads. A pivot chart takes an afternoon. The next export means building it again.
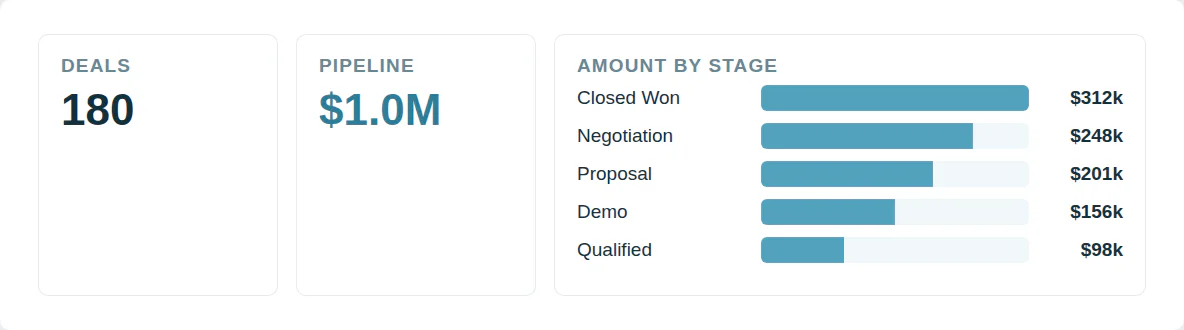
Pick two columns and the chart builds itself beside tables and number cards.
Share a dashboard with nothing uploaded
Most chart makers keep a copy of your data. A customer list should not sit on a stranger’s server. A screenshot goes stale the next day.
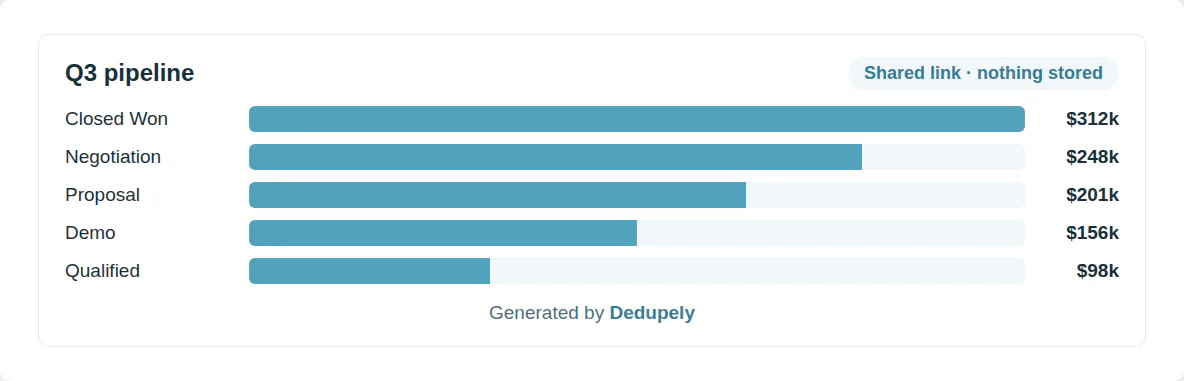
The dashboard and its data travel inside the link and are never stored.
Questions about making a chart from a CSV

Choose the CSV file or paste its rows. A first dashboard is drawn from your columns, and every chart can be changed or removed.
Bar, horizontal bar, stacked bar, line, area, pie, doughnut and scatter charts, plus tables, number cards and text notes.
Yes. Count rows, or sum, average or find the minimum or maximum of a number column, grouped by any column or by month, quarter or year.
The dashboard and the columns it uses are compressed into the link itself. Anyone with the link sees the dashboard, and nothing is stored on a server.
Anyone you send the link to. The data is in the link, so share it the way you would share the file.
Download the whole dashboard as a PDF, save any chart as a PNG, or keep the share link to open it again.
No. The charts are drawn in your browser and the file never leaves your computer.
Yes. Make as many charts as you like and ten share links a day.
More free tools


Get started for free
20 free trial merges and as much free support as you need to get your duplicates under control.

 Or sign up with Google
D Wright
HubSpot User
 HubSpot Marketplace
 Running CRM cleanup for clients? See the Partner Program